SurveyVisualizer
2.3.1
Size: 29.7 MB
Downloads: 3147
Platform: Windows (All Versions)
Without specialized programs, huge amounts of data are impossible to process, even for the most capable minds. SurveyVisualizer can spare you from looking over vast spreadsheets with complex statistics. Its purpose is to display such data in a way that is much easier to understand. It can process multi-dimensional data, but instead of displaying the information in several tables and ranked lists, it presents everything in an interactive graph.
The application is available in English, German and French, for Windows, Mac OS X and Linux platforms. The setup file for the Windows version is the largest, but it should not take long to download with a modern Internet connection. The installation process is fast and easy, so you can have the software up and running in no time.
The first thing you need to know about SurveyVisualizer is that it is distributed as a freeware viewer for processed data, in a proprietary format. In other words, you can use this software only to view statistics. If you wish to process information, you have to purchase its counterpart, SurveyCompiler.
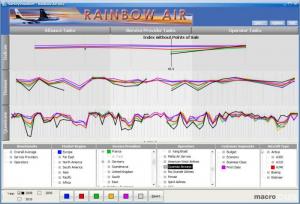
When you load a data file, in SurveyVisualizer's native format, the application will display the information as several graphs, in three charts, on the user interface. You can hover with the mouse cursor over the graphs, if you wish to see names and values. Besides that, you may click a graph to highlight it. The graphs represent certain resources, which can be defined in SurveyCompiler. All resources are neatly organized, in separate tree structures, beneath the charts, on SurveyVisualizer's interface. Besides selecting a resource, to highlight its graph, you can also color code the resources and their graphs.
The charts are divided into multiple sections, which can be expanded vertically and horizontally, by clicking their column and line headers. When you expand a section, the others will retract, creating a zooming effect. You can also right click and select an option for the same effect or a different one, for zooming in further, on a specific axis.
Pros
The software is capable of displaying huge amounts of statistics in a format that is very easy to understand. You can highlight and color code graphs and zoom in on certain portions. SurveyVisualizer is distributed as a freeware application and it can be installed in no time.
Cons
You can only view data, with SurveyVisualizer. If you wish to compile it, you have to purchase a separate application. With SurveyVisualizer, you can view and understand any kind of statistics, regardless of their complexity.
SurveyVisualizer
2.3.1
Download
SurveyVisualizer Awards

SurveyVisualizer Editor’s Review Rating
SurveyVisualizer has been reviewed by Frederick Barton on 16 May 2013. Based on the user interface, features and complexity, Findmysoft has rated SurveyVisualizer 5 out of 5 stars, naming it Essential


